|
HOME
New Article:
THE MIDWEST: Hole in the Donut
New Article:
EMPIRE TRAP
New Article:
MILITARY BUILDUP (PDF File)
New Article:
IMMIGRATION
New Article:
JESUS AND EMPIRE
Core Concepts:
NONPRODUCTIVE GOVERNMENT
Core Concepts:
EVERY OTHER
GENERATION
Graph:
CRIME
AND MILITARY SPENDING
Graph:
REAGANOMICS
Graph:
LONG
TERM TREND
Graph:
FEDERAL SPENDING
ABOUT THE AUTHOR
ORDER
BOOKS AND TAPES
| |
|
|
|
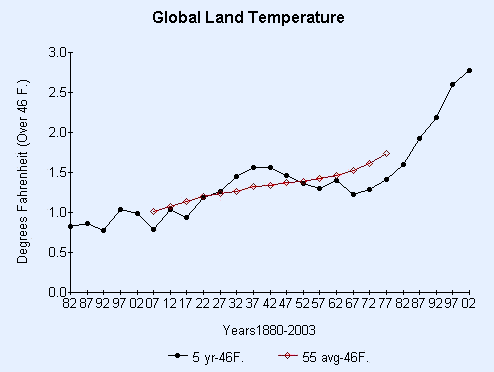
Notice how smooth and straight the 55 year average "red" trend is until the last three points when it begins to bend upward. This is what the Greenhouse Gases are doing to the planet especially in the last fifteen years (after 1990). Notice the relative peak in 1937-1942 points at almost the same level in the 1940 maximum. now look at the 1994 maximum. The 1992 point begins to curve down, but then the 1997 and 2002 point continue upward. The 1992-1997 points should be like the 1937-1942 points, but instead manmade global warming surges upward beyond the normal cycle curve. However, the Kondratiev Wave seems to be continuing normally in the economic and political dimensions with the strong 90's economy and the 2003 Iraq War.
|
|